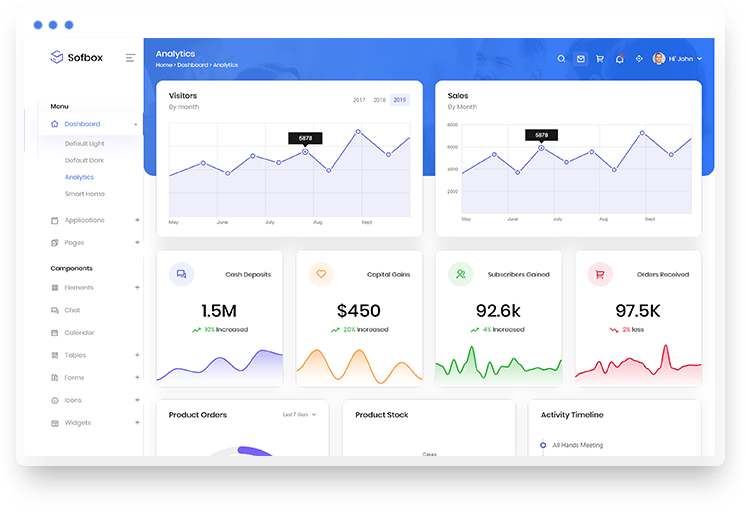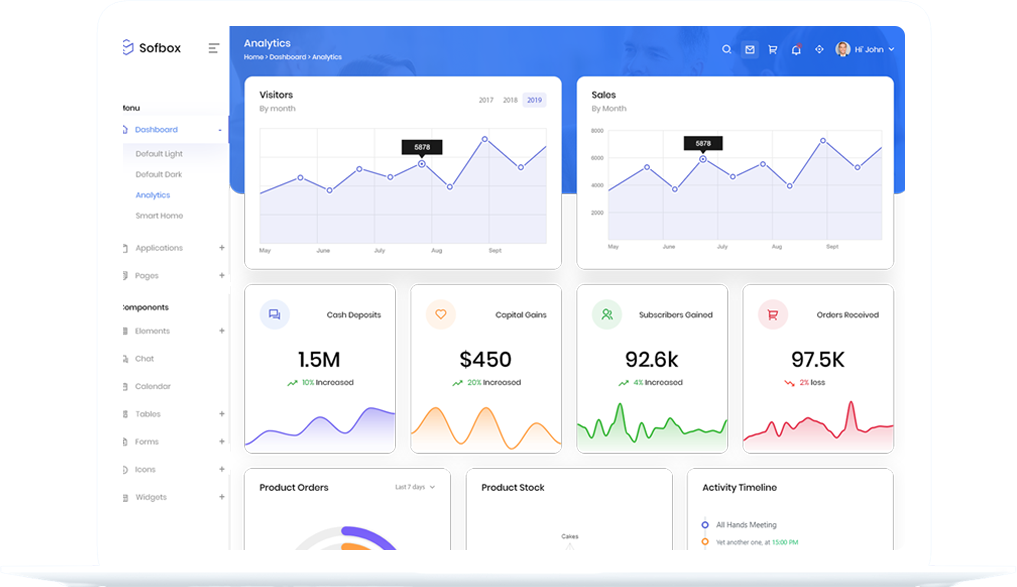

Data Visualization Software
The point of using Lorem Ipsum is that it has a more-or-less normal distribution of letters, as opposed to using Content here, content here', making it look like readable English.


50 +
Trading Volume(USD)20 +
Data Transactions10 +
Our Happy Users200 +
Custom Portfolios Createdthe Power of Visual Analytics.
There are many variations of passages fact that a reader will be distracted by the readable content of a page when looking at its layout. The point of using Lorem Ipsum is that it has a more-or-less normal distribution.
Data Visualization
Established fact that a reader will be distracted readable looking layout.
Organization
Reader will be distracted by the readable content when looking.
Innovation
Distracted by the readable content of a page when layout.
Perfect Event
Fact that a reader will be distracted page when looking at its layout.


Get and blend data from multiple sources
Long established fact that a reader will be distracted by the readable content of a page when looking at its layout.
Get tips on how to skyrocket your sales.
Faff about only a quid blower I don’t want no agro bleeding chimney pot burke tosser cras nice one boot fanny.!


Way to make your data dazzle
Recent Blog
In a world where data is king, keeping it safe and sound is crucial. This blog post delves into the vital aspects of data privacy and security in the realm of data analytics. We’ll show you how we’re the guardians of your data. The Value of Data Data is valuable, but it’s also sensitive. It’s […]
Are you curious about how data can help your business thrive? You’re in the right place! At Data Authors, we believe that data analytics isn’t just for tech wizards; it’s for everyone looking to make smarter decisions. In this blog post, we’ll walk you through the basics of data analytics and why it’s a game-changer […]
Data analytics might sound like a complex term, but it’s actually all about making sense of the information we have. In this blog post, we’ll take you on a journey into the basics of data analytics. What Is Data Analytics? Data analytics is like detective work, but with numbers. It involves collecting data, examining it, […]
Have you ever heard the saying, “A picture is worth a thousand words”? Well, that’s exactly what data visualization is all about. In this blog post, we’ll dive into the world of data visualization and how it helps you understand data without needing a degree in statistics. What Is Data Visualization? Data visualization is like […]
In a world full of choices, making the right decisions can be a challenge. This blog post is all about how data-driven decision-making can light your path to success and help you make the best choices for your business. Every Decision Counts From choosing the right products to understanding your customers’ needs, decision-making is at […]
Just as you wouldn’t serve a meal without proper preparation, you shouldn’t analyze data without cleaning and getting it ready. In this blog post, we’ll explore the essential steps of data cleaning and preparation that turn raw data into a valuable asset. Why Data Cleaning Matters Data isn’t always in perfect shape. It can be […]
Are you curious about how data analytics can benefit your specific industry? In this blog post, we explore how data analytics offers tailor-made solutions for different sectors, helping businesses thrive in their unique landscapes. One Size Doesn’t Fit All Just as one-size-fits-all clothing doesn’t work for everyone, the same goes for business strategies. Different industries […]
As we move further into 2024, the landscape of Business Intelligence (BI) continues to evolve, driven by technological advancements and shifting business needs. Here are some key trends shaping the future of BI this year. In 2024, staying ahead in the BI game means embracing these trends and continuously adapting to new technologies and methodologies. […]
In the rapidly evolving field of business intelligence (BI), choosing the right tool can significantly impact an organization’s ability to analyze data, generate actionable insights, and make informed decisions. Among the plethora of options available, Microsoft Power BI, Qlik, Tableau, and Google Looker Studio stand out as leaders in the space. Each tool offers unique […]


